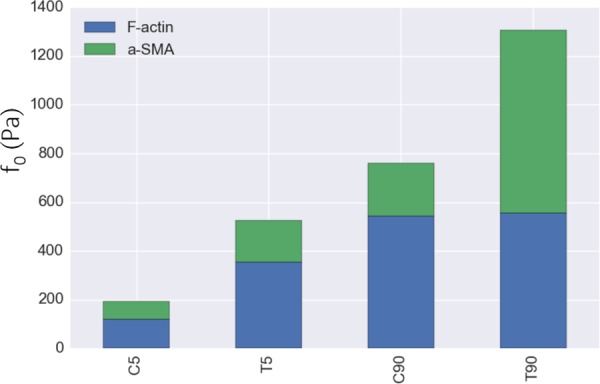
Fig. 9.

Computed contributions of the F-actin and α-SMA to the maximum contraction strength for each group. The stacked green/blue columns represent the estimated maximum contraction strength values (f0,estimated) calculated by fitting Eq. (13) to the f0 values. F-actin contributed to the contraction strength up to a certain point when the VICs were activated in T5 and C90 groups. However, almost all of the increase in contraction strength in T90 group to C90 group was due to α-SMA contribution.
