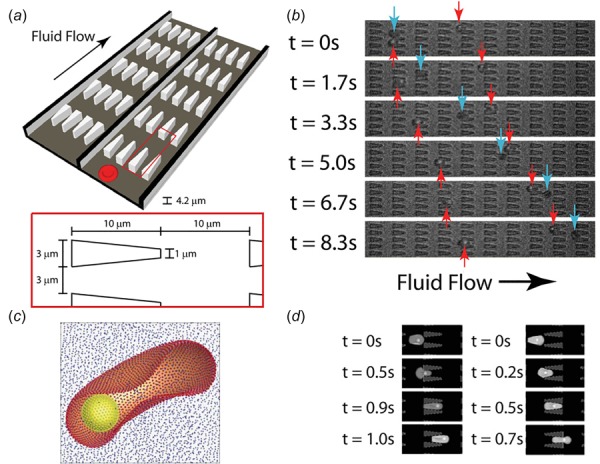
Fig. 4.

(a) Illustration of the flow cytometer device. (b) Experimental images of ring-stage infected (dark gray arrows) and uninfected (light gray arrows) RBCs in the channels. (c) The computational RBC model consists of 5000 particles connected with links. The parasite is modeled as a rigid sphere inside the cell. (d) DPD simulation images of Pf-RBCs traveling in channels of converging (left) and diverging (right) pore geometries. (Reproduced with permission from Bow et al. [142]. Copyright 2011 by Royal Society of Chemistry).
