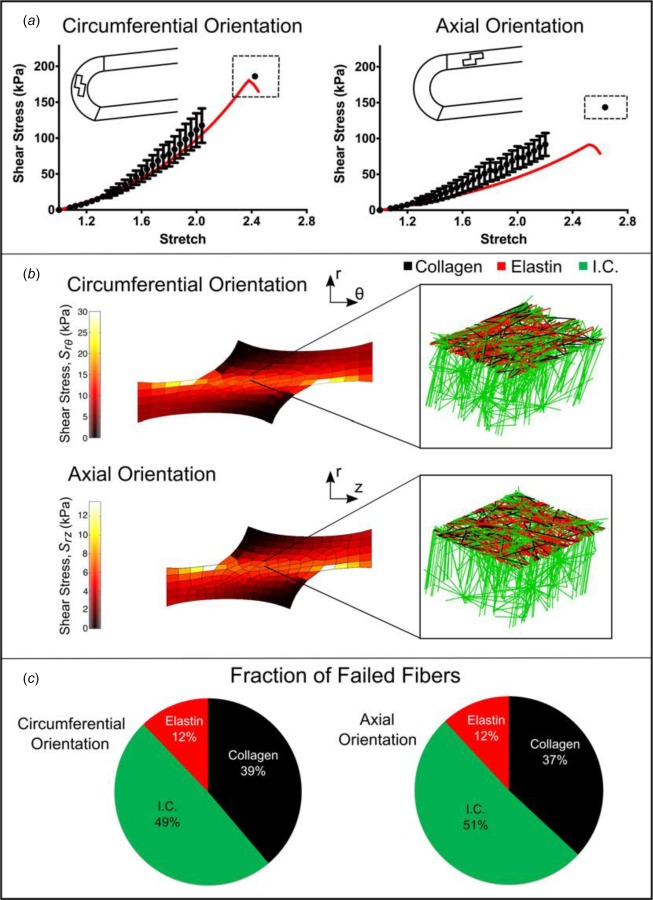
Fig. 9.

Shear lap failure. (a) PK1 stress versus grip stretch for circumferentially (n = 28) and axially (n = 26) orientated samples (dots, mean ±95% CI). Error bars are only shown for stretch levels up to the point at which the first sample failed. The final dot shows the average stretch and stress at tissue failure and the dashed rectangle indicates the 95% confidence intervals of stretch and stress at failure. The red lines show the model results. (b) Shear stress distributions along the axis of applied deformation for both the circumferentially and axially aligned simulations, accompanied by an enlarged view of a network with the upper interlamellar connections removed to make the collagen and elastin visible. (c) Fraction of failed fibers of each type in the simulated experiment (I.C. = interlamellar connections).
