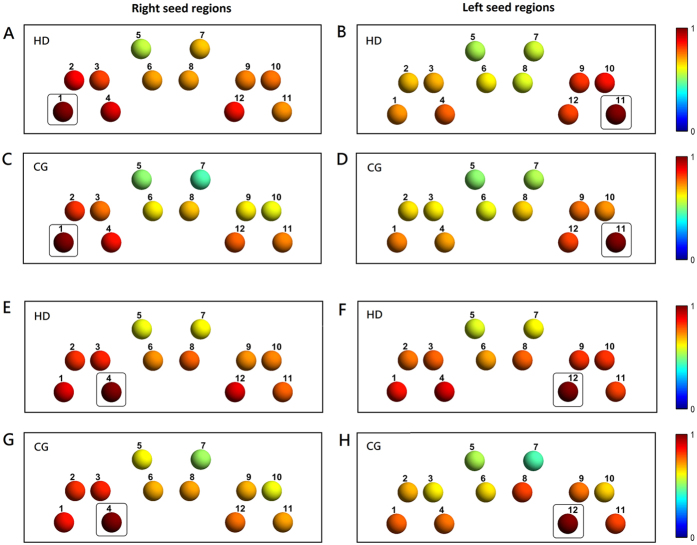
Figure 2. Seed-based rsFC Z-R maps of the OFC systems.
(A,B) and (E,F) represent the HDs. (C,D) and (G,H) represent the CGs. The left column indicates the right seed channel OFC regions, and the right column indicates the left seed channel OFC regions. Channels that had enhanced rsFC with OFC seed regions are displayed in warm colors. The selected seed channels are boxed. The seed channels were selected based on the localizer task activation seed channels (i.e., channel 11 with its symmetrical channel 12 for the left side and channel 4 with its symmetrical channel 1 for the right). Each channel is numbered. Color bars represent the HbO-based Z to R correlation coefficient values.

