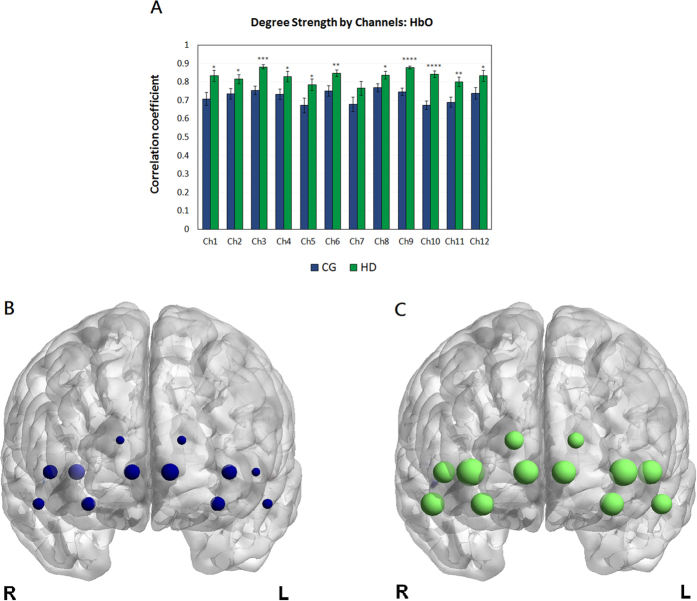
Figure 4. Connectivity strength by channel.
(A) Connectivity strength with the group average of the correlation coefficients in OFC of the HDs (green) and CGs (blue). Error bars indicate the standard error of the mean across the HDs and CGs. Compared with the CGs, the HDs showed significantly greater connectivity strength in almost all the channels, except channel 7, in terms of HbO. (B,C) The size of each node indicates its corresponding nodal strength in the networks of two groups (CG, blue; HD, green). The strength values are shown in Supplementary Table S4. *p < 0.05; **p < 0.01; ***p < 0.001; ****p < 0.0001.

