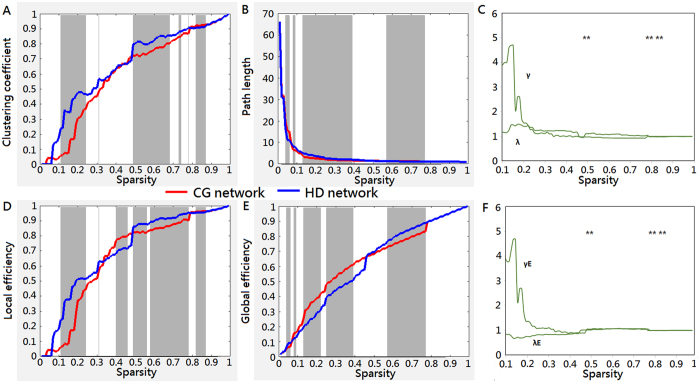
Figure 5. Comparison of the HD brain network to the CG brain network: Small-worldness and network efficiency.
Network parameters were based on the functional networks generated from the HbO measurements over a wide range of sparsity. (A) Clustering coefficient, (B) characteristic path length, (D) local efficiency, and (E), global efficiency, were the network properties under study. For the entire range of sparsity thresholds from 0 to 1, the brain network in the HDs (blue) had greater clustering coefficients and local efficiency values than the brain network in the CGs (red). Normalized clustering coefficients (γ, green) and normalized path lengths (λ, green) with respect to the CG network are shown in (C). Normalized local efficiency (γE, green) and normalized global efficiency (λE, green) with respect to the CG network are shown in (F). The normalized path length and global efficiency values in both groups shared similar patterns, resulting in γ and γE > 1 and λ and λE = ~1. These findings may indicate that the rsFC networks in the HDs carried small-world characteristics with respect to the CG networks. The gray zones represent a significant (pFDR < 0.05) difference between the HD network and the CG network. The asterisk (*) represents a significant (p < 0.025) difference between the small-world network measures from the intuitive normalization method and the traditional normalization one. The comparison of the brain networks to random networks are shown in Supplementary Figure S5. The small-worldness measures from both the intuitive and traditional normalization methods are shown in Supplementary Figure S6.

