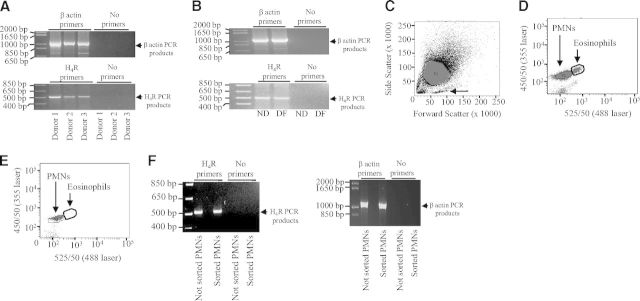
Figure 6. Expression of the H4 receptor in human PMNs.
RNA was extracted from nondifferentiated PLB-985 cells (ND), PLB-985 cells differentiated along the granulocytic pathway (DF), and human PMNs derived from three different donors (Donors 1–3). Thereafter, 1 μg of each RNA preparation was reverse-transcribed. The obtained cDNAs were used for PCR reactions using validated primers for H4 receptor (H4R) or β-actin. The amplified PCR products were separated on a 3% agarose gel containing ethidium bromide. The bands were visualized by UV illumination. The positions of (A) H4 receptor and (B) β-actin PCR products are indicated by arrows (right) in each. (C) Human PMNs (P1) were analyzed by flow cytometry. Forward- and side-scatter profiles are shown. Contaminating mononuclear cells are indicated by an arrow. (D) Eosinophils and PMNs (P2) can be distinguished when excited with 488 nm laser (525/50 nm) and 355 nm laser (450/50 nm). (E) Analysis of the sorted PMNs (P2) shows removal of autofluorescent cells. (F) The positions of H4 receptor PCR products (left) and β-actin PCR products (right) in not-sorted and sorted PMNs are indicated by arrows (right) in each.

