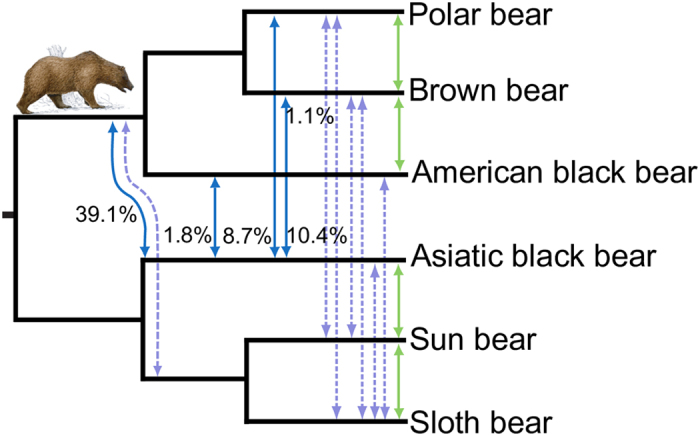
Figure 4. Graphical summary of gene flow analyses using D and DFOIL statistics on a cladogram.

DFOIL analyses estimated the percentage of GFs rejecting the species tree and indicating gene flow. Blue arrows show values >1%, and dashed lavender for <0.1% (Table 1). These percentages do not indicate the amount of introgressed DNA, which can be a fraction of the GF sequence. Green arrows depict significant D-statistics data for gene flow signal. Some gene flow cannot have occurred directly between species, because the species exist in different habitats, but may be remnants of ancestral gene flow or gene flow through a vector species.
