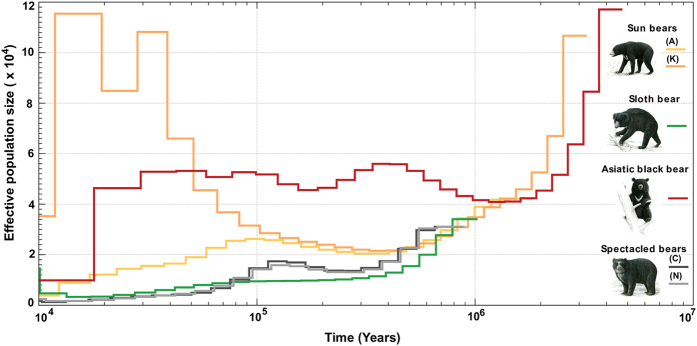
Figure 6. Historical effective population sizes (Ne) using the pairwise Markovian coalescent (PSMC) analyses for the newly sequenced bear genomes.
X-axis:time, y-axis:effective population size (Ne). The two sun bears have radically different, non-overlapping population histories (Supplementary Fig. 21). The Asiatic black bear had a constant large Ne since 500 ka similar to that of the brown bear and consistent with a wide geographic distribution and high heterozygosity (Supplementary Fig. 4).

