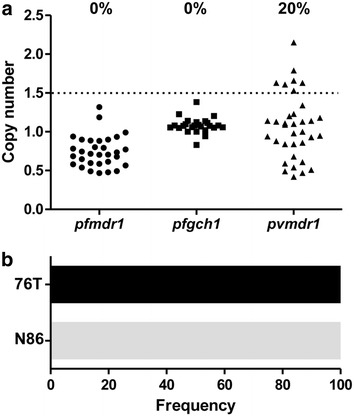
Fig. 1.

Polymorphism analysis in genes of P. falciparum and P. vivax isolates from different Brazilian Amazon regions. a Copy number variation in genes of P. falciparum and P. vivax. Only samples with relative quantification above 1.5 were considered amplified. Amplification rates for each gene are indicated in the graph. b Frequency of the 76T mutant allele in pfcrt and N86 wild-type allele in pfmdr1. The frequencies of wild-type and mutated alleles are shown in black and gray, respectively
