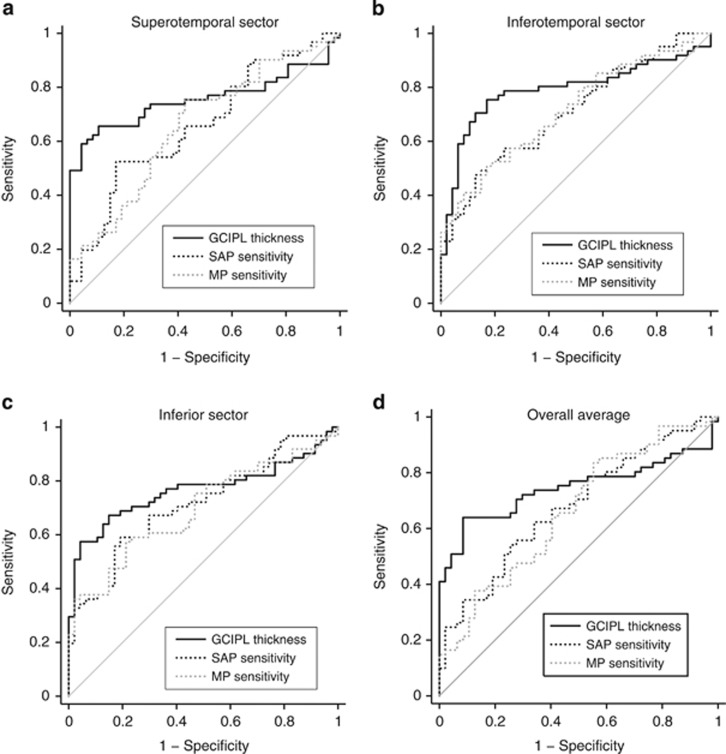
Figure 2.
ROC curves showing the diagnostic abilities of ganglion cell-inner plexiform layer (GCIPL) thickness and standard automated perimetry (SAP) and microperimetry (MP) sensitivities of (a) superotemporal sector, (b) inferotemporal sector, (c) inferior sector, and (d) overall average measurement.

