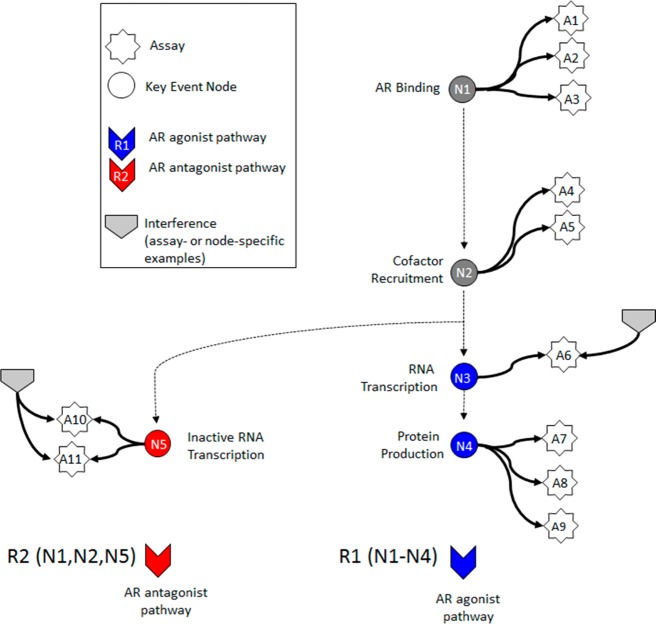
Figure 2.
Graphical representation of the AR pathway model based on Tox21/ToxCast assays: Circular nodes (N1–N5) represent key biological events along the pathway, where dark gray coloring indicates key events common to agonism and antagonism, and blue and red coloring indicates key events specific to agonism or antagonism, respectively. White stars (A1–A11) represent the in vitro assays that measure activity at the biological nodes. Colored arrow heads (R1/R2) represent true AR agonism/antagonism, respectively, and are comprised of the nodes listed in the diagram and their associated assays. Light gray arrow heads demonstrate examples of technology-specific interference or biological interference pathways, where individual assays or specific groups of assays are positive due to non-AR-mediated activity. Each in vitro assay and each key event node has an assay- or biology-specific interference pathway (defined in Table 1). Interference pathways R3–R7 correspond to nodes N1–N5, respectively, and interference pathways A1–A11 correspond to the respective assays. Two examples of interference pathways, one that is assay-specific (A6) and one that is node-specific (R7), are shown as light gray arrow heads. AR = androgen receptor.

