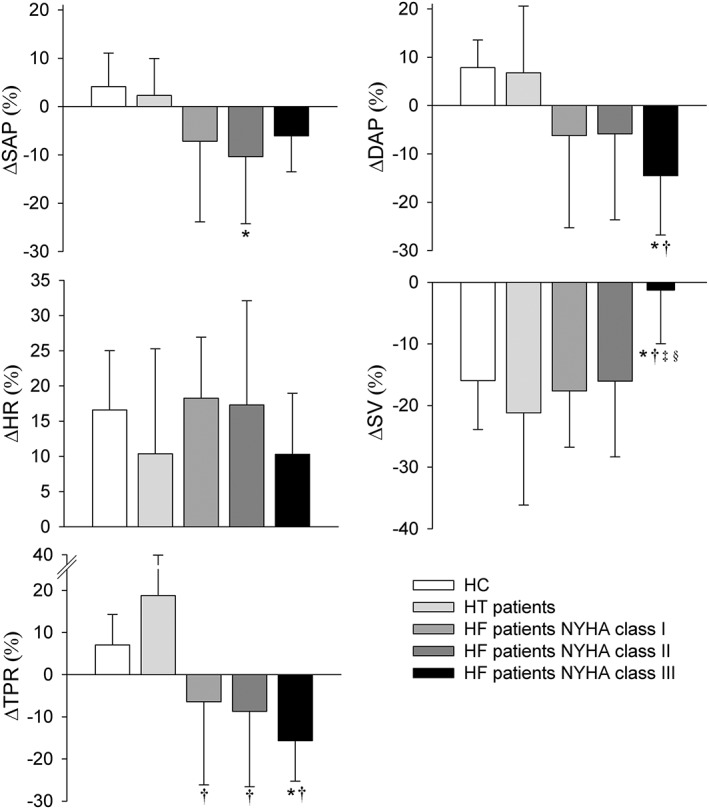
Figure 4.

Postural response at 60 s of standing in HF patients (NYHA I, II, and III), HT patients, and healthy controls with respect to the supine position. Abbreviations: refer to Figure 1. *P < 0.01 vs. healthy controls; †P < 0.01 vs. HT patients; ‡P < 0.01 vs. HF patients NYHA class I; §P < 0.01 vs. HF patients NYHA class II.
