Figure 1.
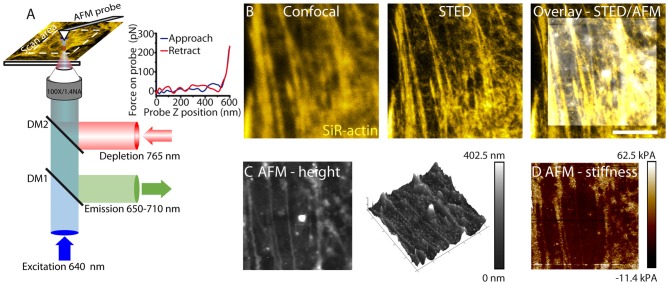
Correlative stimulated emission depletion (STED)/atomic force microscopy (AFM) imaging. (A) Schematic of STED/AFM imaging set-up. Fluorescence excitation pulses (640 nm) are combined with depletion pulses (765 nm) using a dichroic mirror (DM2, 730 nm short-pass). The depletion pulse is spatially shaped by an spatial light modulator (SLM) into an aberration corrected vortex beam. Fluorescent emission is separated using a dichroic mirror (DM1, custom). AFM images are acquired after STED imaging. AFM images are acquired pixelwise by translating the sample. The AFM cantilever is aligned such that STED and AFM have a common 80 × 80 μm scan area. For each pixel a force curve is measured by approaching the tip toward the sample and recording the tip-sample interaction force as a function of the cantilever z-position. An example force curve is shown in the inset. The Young’s modulus is estimated from the gradient. (B) STED microscopy (center) enhances resolution of actin filaments relative to confocal microscopy (left), revealing fine filamentous structure. The STED image is overlaid with an AFM height profile (right). (C) The sample height (left) as measured by AFM. The color scale represents the range in sample height between 0 nm and 402.5 nm. Cytoskeletal components are detected through the cell membrane. The height image is also represented as a 3D map. (D) Young’s modulus (stiffness) is shown. The color scale ranges from −11.4 kPa to 62.5 kPa and represents values measured from the force curve.

