Figure 4.
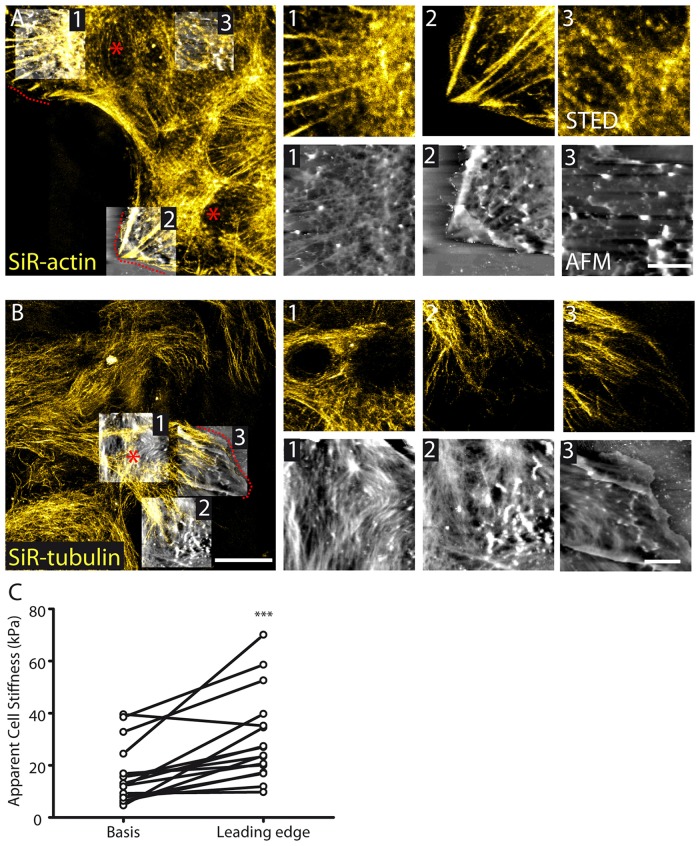
Cytoskeletal and membrane stiffness reorganization in migrating astrocytes. (A) STED images reveal polarized stress fibers in the direction of migration with corresponding fibers appearing in AFM images 1 and 2. At the basis of the protruding cell (e.g., AFM image 3) actin organization appears to be reduced in both STED and AFM images (AFM height range: region 1; 564 nm, region 2; 814 nm, region 3; 942 nm). (B) Tubulin appears polarized in the direction of migration in astrocytes (AFM height range: region 1; 297 nm, region 2; 322 nm, region 3; 396 nm). The dash lines and asterisks (red) indicate the leading edges and bases, respectively, of the protrusions. (C) Cellular stiffness is increased at the leading edge of protruding cells relative to the basis center of the protrusion (n = 16, p < 0.001, paired t test). Asterisks indicate statistical significance (***p < 0.001).

