Figure 1.
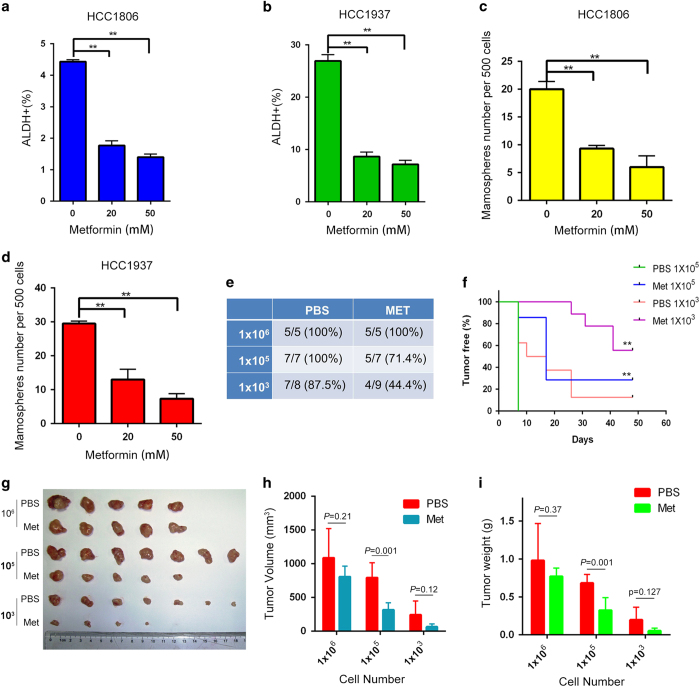
Metformin suppresses TNBC stem cells in vitro and in vivo. (a) In HCC1806 cells, metformin inhibited cancer stem cells (CSCs) in vitro according to the ALDH assay. The cells were treated with different concentrations of metformin for 24 h and digested. Twenty thousand cells were resuspended in 1 ml assay buffer for the ALDH assay. All samples were incubated for 45 min. The cells were resuspended in 0.5 ml assay buffer and subjected to flow cytometry analysis. The results are shown as bar graphs with the mean±s.d., n=3 independent experiments. The statistical significance was determined by Student’s t-test. **P<0.01. (b) In HCC1937 cells, metformin inhibited CSCs in vitro according to the ALDH assay. (c) In HCC1806 cells, metformin inhibited CSCs in vitro according to the mammosphere culture. The cells were treated with metformin for 24 h before they were plated onto 24-well ultra-low attachment plates (500 cells each well). The first passage spheres whose diameters were >60 μm after 14 days in culture were counted. The results are shown as bar graphs with the mean±s.d., n=3 independent experiments. The statistical significance was determined by Student’s t-test. **P<0.01. (d) Metformin inhibits HCC1937 CSCs in vitro as measured by the mammosphere culture. The first passage spheres whose diameters were >60 μm after 14 days in culture were counted. The results are shown as bar graphs with the mean±s.d., n=3 independent experiments. The statistical significance was determined by Student’s t-test. **P<0.01. (e) Metformin inhibited CSCs in vivo according to the limited dilution assay. HCC1806 cells were treated with metformin (40 mM) or PBS for 48 h. Cells were injected into the fat pads of 7–8-week-old BALB/C nude mice. Tumorigenesis was recorded after 7 days. The incidence of tumors in nude mice is listed based on the different cell numbers that were seeded. (f) The tumor-free survival curves of the nude mice that were inoculated with different numbers of HCC1806 cells with and without metformin treatment are shown. The statistical significance was determined by log-rank test. The 1×10⁵ and 1×10³ groups are shown. **P<0.01. (g) The tumors harvested at the end of the experiment. (h) The tumor volumes at the end of the experiment. Tumor size was measured by vernier calipers, and tumor volumes were calculated according following formula: tumor volume (mm3)=π(length×width2)/6. The statistical significance was determined by Student’s t-test. The difference between metformin and PBS treatment is significant (P<0.01) when 1×10⁵ cells were seeded. Similar trends were observed in the other groups. (i) Tumor weights at the end of the experiment. The statistical significance was determined by Student’s t-test. The difference between metformin and PBS treatment is significant (P<0.01) when 1×10⁵ cells were seeded. Similar trends were observed in the other groups.

