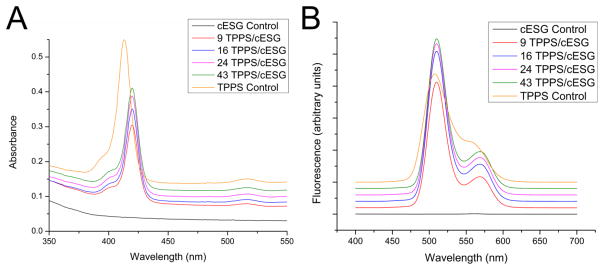
Figure 4.
Absorbance (A) and fluorescence emission spectra at 420 nm excitation (B) of TPPS and cESG-TPPS formulations (3 μM TPPS). Spectra are stacked for visualization. cESG encapsulated TPPS exhibits a red shift in maximum absorbance of the Soret band. n=3 independent syntheses measured in triplicate.

