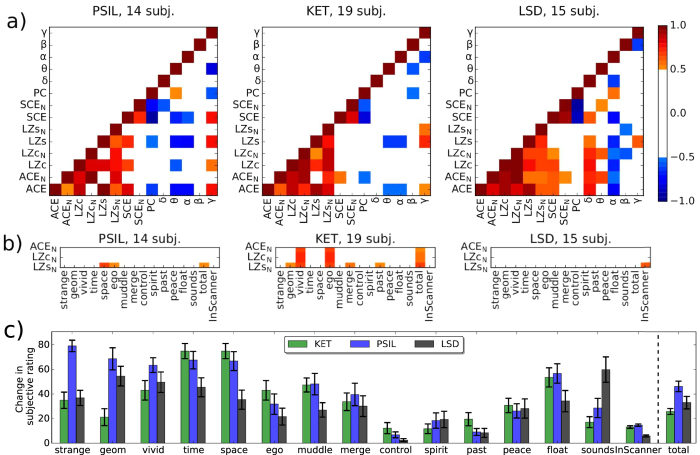
Figure 4. Correlations across measures and questionnaire answers.
(a) For each drug, a matrix indicates in colour the Pearson correlation, r, of the score difference between drug and placebo condition (averaged across trials) of each measure pair across participants. The upper triangular entries and entries with |r| < 0.5 are omitted (and set white) to highlight strong correlations only. These correlations should be considered somewhat exploratory and are not controlled for multiple comparisons as each experiment had a limited sample size. Across drugs, signal diversity measures show high correlation with each other, yet inconsistently, as they capture different flavours of signal diversity. (b) Correlations between the changes in the measures ACEN, LZcN and LZsN and the questionnaire scores (same scale as above). No consistent correlation across drugs was found for any combination of the measure’s scores and scores for a particular question. (c) The changes in subjective ratings under each drug condition are shown as averages with standard error bars across subjects. The average of all changes across these 14 questions (except “InScanner”) is denoted as “total” and shown normalised by factor 20 in order to fit the scale. No consistent differences are apparent across drugs.

