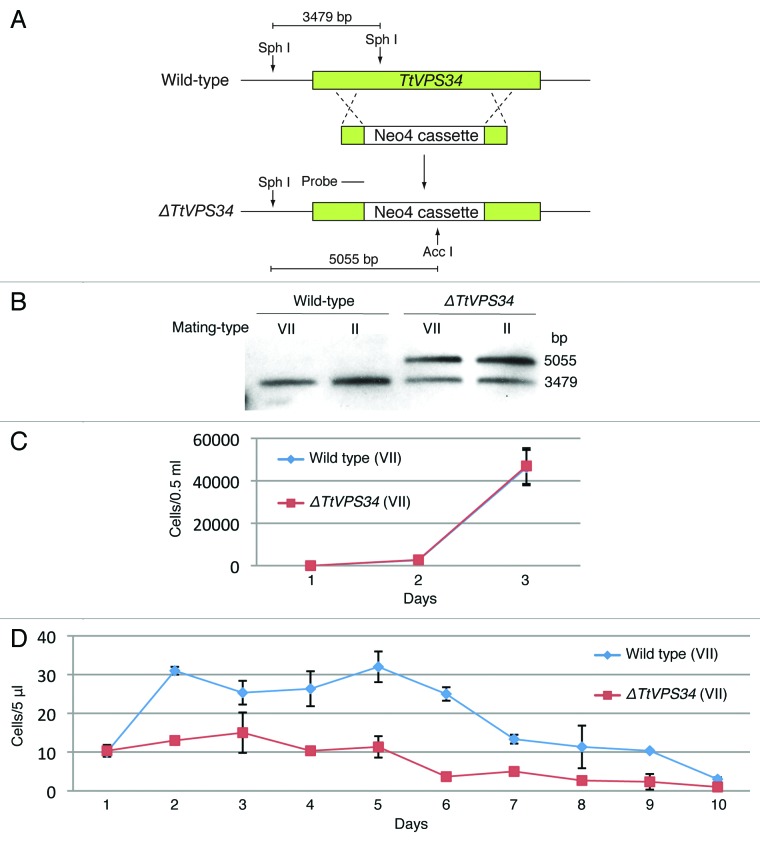
Figure 2. Generation of somatic TtVPS34 gene-knockdown mutants. (A) A schematic showing the TtVPS34 genomic locus (upper), the plasmid vector carrying Neo4 cassette (middle) and after homologous recombination (lower). (B) Southern blot analysis of AccI and SphI digested genomic DNA from wild-type cells and TtVPS34∆ mutants. Molecular weight of the signals against the probe corresponds to the prediction in (A). (C) Cell-growth curves in nutrient-rich conditions. The cells (0.5 ml) maintained in the medium for 1, 2, and 3 d were fixed with paraformaldehyde, diluted 100× and counted under a microscope. (D) Remaining cells in nutrient-deprivation conditions. The cells inoculated in 10 mM TRIS-HCl pH 7.2 were sampled (5 μl) every 24 h until day 10 and swimming (living) cells were counted under a microscope. Points and attached bars correspond to the mean of the 3 identical measurements and standard deviations.

An official website of the United States government
Here's how you know
Official websites use .gov
A
.gov website belongs to an official
government organization in the United States.
Secure .gov websites use HTTPS
A lock (
) or https:// means you've safely
connected to the .gov website. Share sensitive
information only on official, secure websites.
