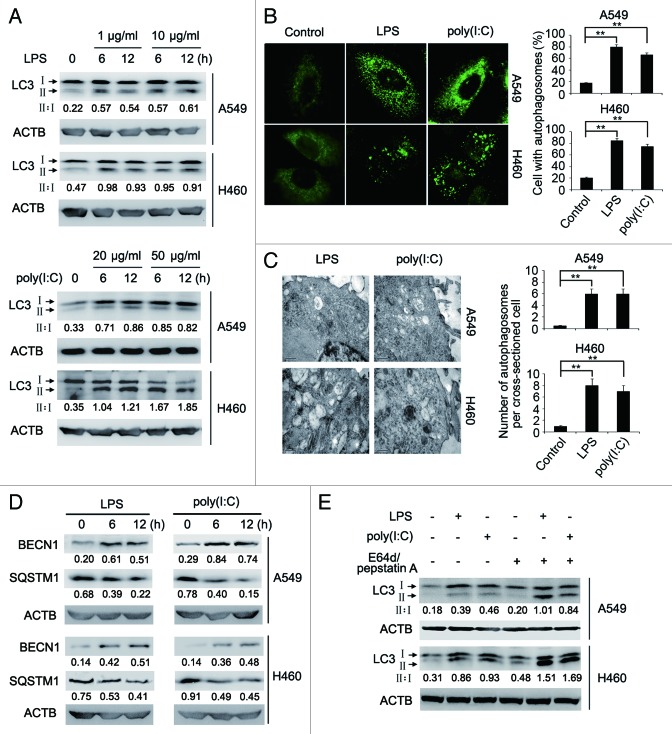
Figure 1. LPS or poly(I:C) induces autophagy in lung cancer cells. (A) Whole cell lysates from A549 and H460 cells treated with indicated doses of LPS or poly(I:C) for the indicated time were subjected for immunoblot analysis of LC3 and ACTB (as a loading control). The LC3-II to LC3-I ratio (II:I) is shown. (B) After stimulation with LPS (10 μg/ml) or poly(I:C) (20 μg/ml) for 12 h, A549 and H460 cells were immunolabeled with LC3 antibody followed by Alexa Fluor 488-conjugated secondary antibody (green). Images shown are representative fluorescence confocal microscopic photographs (left panel). Original magnifications: 630×. Quantification of the percentage of cells with autophagosomes is shown (right panel). (C) Ultrastructural features of A549 and H460 cells treated with LPS (10 μg/ml) or poly(I:C) (20 μg/ml) for 12 h, as revealed by transmission electron microscopy (left panel). Graph represents quantification of the number of autophagosomes per cross-sectioned cell (right panel). (D) Whole cell lysates from A549 and H460 cells treated with LPS (10 μg/ml) or poly(I:C) (20 μg/ml) for the indicated time were subjected for immunoblot analysis of BECN1, SQSTM1, and ACTB (as a loading control). Numbers below lanes indicate densitometry of the protein presented relative to ACTB expression in that same lane. (E) A549 and H460 cells cotreated with or without E64d (10 μg/ml) and pepstatin A (10 μg/ml) were stimulated with LPS (10 μg/ml) or poly(I:C) (20 μg/ml) for 12 h. Whole cell lysates were subjected for immunoblot analysis of LC3 and ACTB (as a loading control). The LC3-II to LC3-I ratio (II:I) is shown. Data are representative of 3 independent experiments with similar results (A, left panel in B–E) or are mean ± SEM from 3 independent experiments (right panel in B and C). **P < 0.01.

An official website of the United States government
Here's how you know
Official websites use .gov
A
.gov website belongs to an official
government organization in the United States.
Secure .gov websites use HTTPS
A lock (
) or https:// means you've safely
connected to the .gov website. Share sensitive
information only on official, secure websites.
