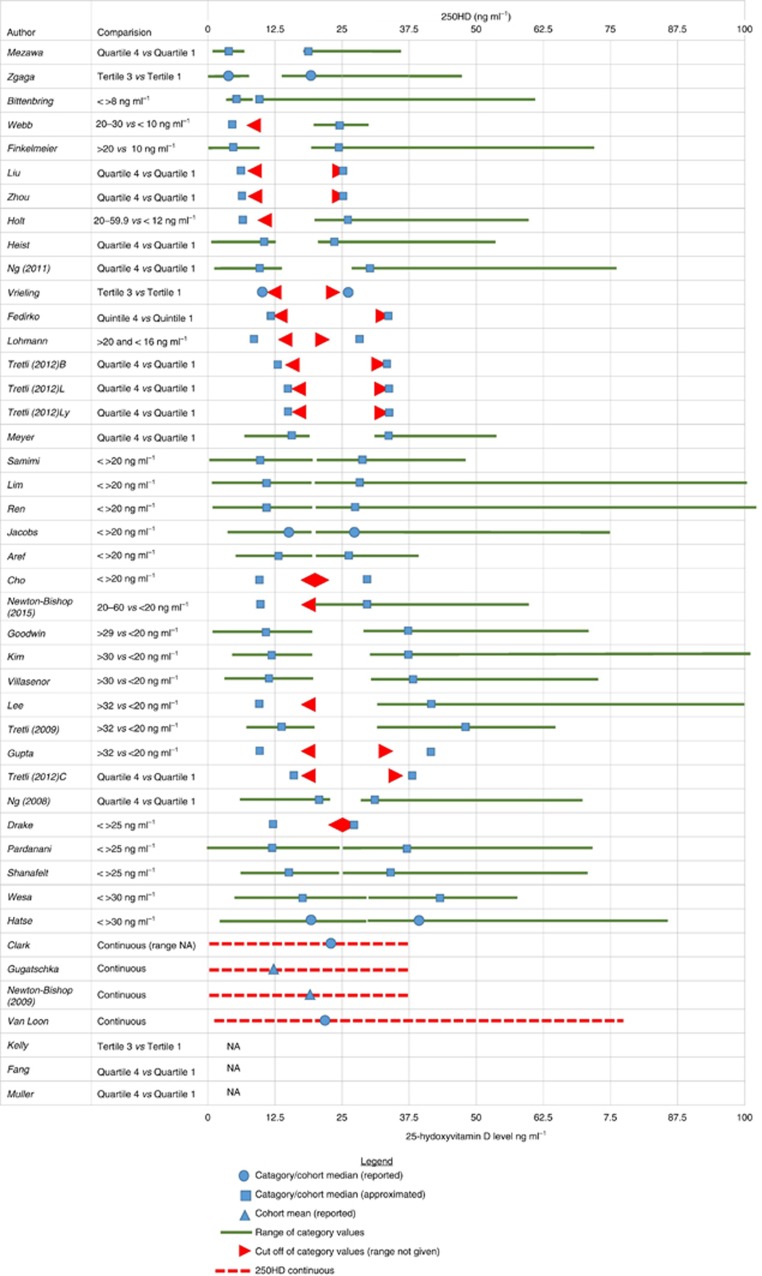
Figure 2.
Large variation in definition of vitamin D categories in studies included in systematic review.Where not given in the paper, median 25OHD concentration for categories compared was requested from study authors and if not subsequently available was approximated. Approximation of the median for each category was performed using the cohort and/or category range where available. For categories defined by numerical cutoffs of 25OHD, the median for the lower category was approximated as the lowest reported 25OHD value (or 0 if category range not given) added to the midpoint of the category upper cutoff minus the lowest reported 25OHD value. For example, Bittenbring et al (Bittenbring et al, 2014) reported outcome according to 25OHD <>8 ng ml−1 groups and reported a study cohort range of 4–61.9. The median of the lower category (<8 ng ml−1) was approximated as the lowest value in the range plus the midpoint of the category that is, 4+((8−4)/2)=6. The upper category median was approximated as the category cutoff (that is, the lowest value in that category) added to the midpoint of the lower category. for example, in the Bittenbring et al, paper the median of the upper category was approximated as 8+((8−4)/2)=10. Where the compared categories were tertiles, quartiles or quintiles, the median of the lower category and upper categories was the midpoint of the difference between upper cutoff of the lower category compared and the lower cut-off of the higher category compared divided by the number of groups between two categories compared, either subtracted from the upper cutoff of the lower category or added to the lower cutoff of the higher category, respectively. For example, Bade et al, (Bade et al, 2014) grouped patients by quartile of 25OHD and report a cohort range of 4–59.6 ng ml−1. Q1 is given as 25OHD<9.86 ng ml−1 and Q4 >24.4 ng ml−1. Therefore, the medians of Q1 and Q4 were approximated as follows: Q1(median)=9.86−(((24.4−9.86)/2)/2)=6.225 and Q4(median)=24.4+(((24.4−9.86)/2)/2)=28. Insufficient data were reported in three studies to allow graphical illustration of categories or approximation of median. NA=data not reported; For Tretli et al, study: B=breast; C=colon; L=lung; Ly=lymphoma.

