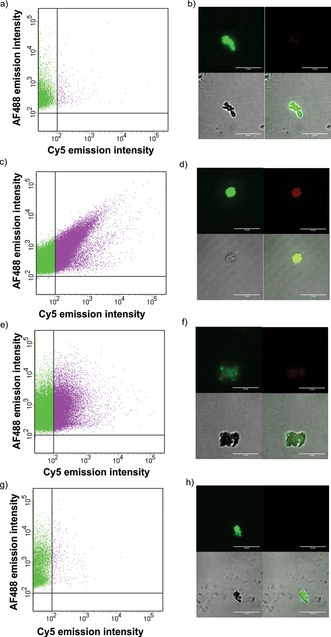
Figure 4.

Flow cytometry (a, c, e, g) and confocal microscopy (b, d, f, h) results for biotin–MIL‐88A particles after incubation with AF488‐SAv followed by incubation with either DNAFM (a, b) or biotin–PNA followed by hybridization with DNAFM (c, d), DNA1MM (e, f), and DNArand (g, h) after washing at 40 °C. In the flow cytometry graphs, only the fractions of particles are shown for which the AF488 intensity passed the relative fluorescence intensity of 100. The green regions indicate particles with a high intensity of AF488 and pink represents a high intensity for both AF488‐SAv and Cy5. In the confocal images (b, d, f, h), the top left panel corresponds to AF488‐SAv, and top right corresponds to Cy5 (marker bound to DNA) fluorescence channels, bottom left is the microscope bright field image, and bottom right is the overlay. Scale bars are 10 μm.
