Figure 5.

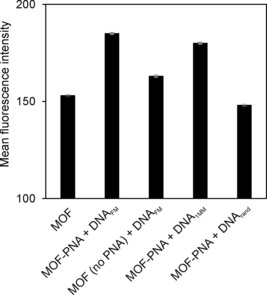
Mean fluorescence intensities as measured by flow cytometry for MOF and MOF–PNA, upon incubation with DNAFM, DNA1MM, or DNArand, after washing at 40 °C. The error bars denote a single standard deviation.

Mean fluorescence intensities as measured by flow cytometry for MOF and MOF–PNA, upon incubation with DNAFM, DNA1MM, or DNArand, after washing at 40 °C. The error bars denote a single standard deviation.