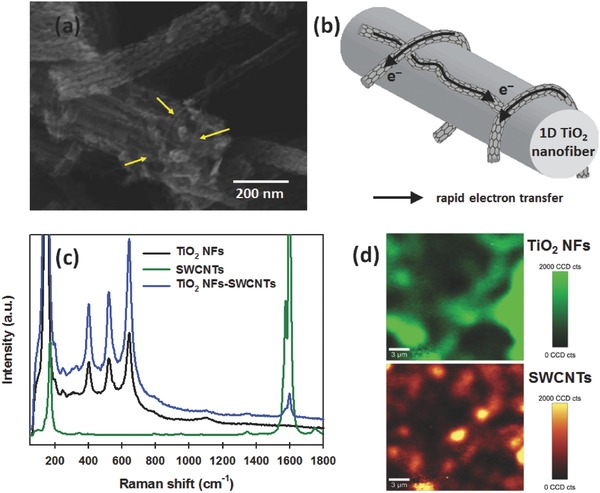
Figure 3.

a) SEM image and b) schematic illustration of TiO2 NF‐SWCNT hybrid. c) Raman spectra of TiO2 NFs, SWCNTs, and TiO2 NFs–SWCNTs. d) Raman mapping image of TiO2 NFs (top, green) and SWCNTs (bottom, orange) in the hybrid sample. In both images, the “bright” regions represent the presence of the materials.
