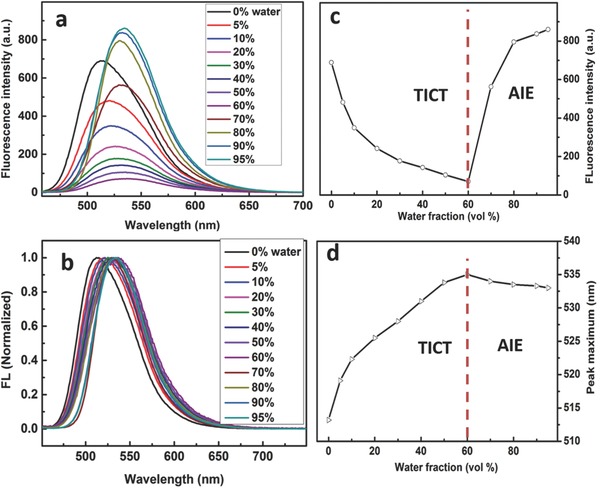
Figure 2.

a) PL spectra and b) normalized PL spectra of CPy in mixed solvents of THF/water (water fraction, v/v%) with the final concentration of 9.15 × 10⁻⁶ m, plot of c) peak intensity and d) peak maximum versus water fraction in the THF–water mixture.
