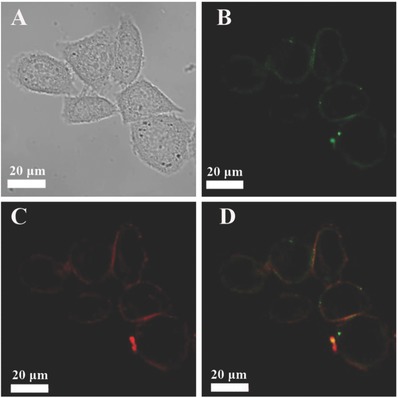
Figure 9.

Fluorescence images of HeLa cells costaining with CPy‐Odots and DiIC18, simultaneously: A) Bright field. B) Confocal fluorescence image collected with 480–580 nm bandpass filters for CPy‐Odots upon excitation at 405 nm. C) Confocal fluorescence image collected with 580–680 nm bandpass filters for DiIC18 upon excitation at 559 nm. D) Corresponding overlayed image of (B) and (C).
