Figure 11.

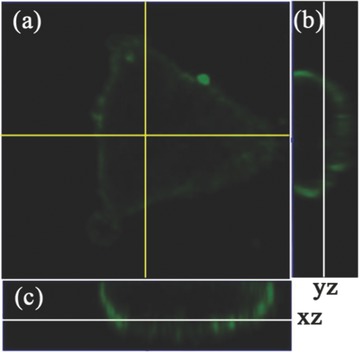
Z‐scan images of living Hela cell incubated with CPy‐Odots: a) an xy image obtained at z = 0.7 μm, b,c) the yz and xz cross‐sections (z = 0–19 μm) taken at the lines shown in panel (a), respectively.

Z‐scan images of living Hela cell incubated with CPy‐Odots: a) an xy image obtained at z = 0.7 μm, b,c) the yz and xz cross‐sections (z = 0–19 μm) taken at the lines shown in panel (a), respectively.