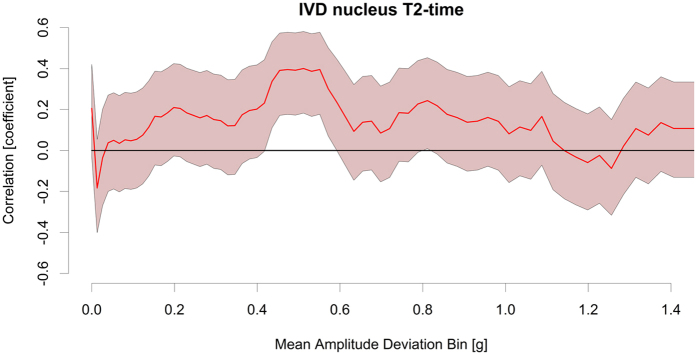
Figure 5. Specific loading levels impact the IVD nucleus T2-time.
Values are mean(95% CI) correlation between IVD nucleus T2-time and count data in each mean amplitude deviation bin. The strongest association to higher IVD T2-times were seen between 0.44 and 0.59 g. This corresponds to fast walking and slow jogging (see Results and Supplementary Table 1).

