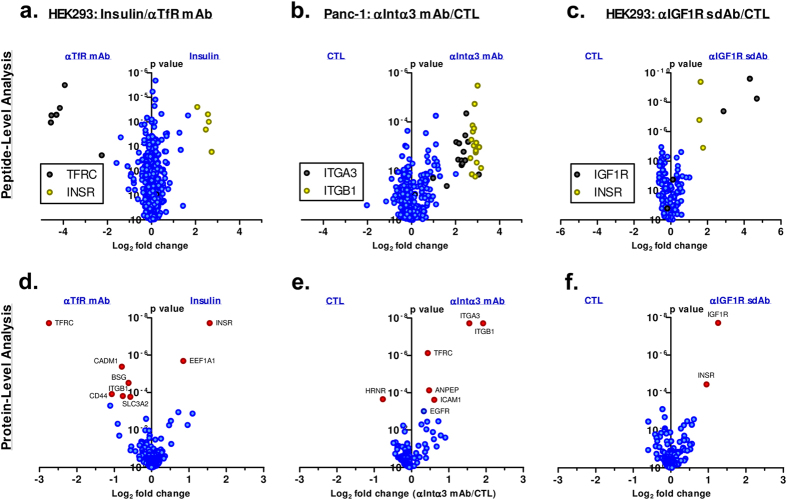
Figure 4. Volcano plots displaying peptide and protein-level results from three ASB biotin transfer experiments.
In each case, the expected cell surface receptor of the ligand(s) of interest was identified. Ligands used include insulin (a,d), a monoclonal antibody against transferrin receptor (a,d) and against integrin alpha 3 (b,e), in addition to a single-domain antibody Fc fusion that was isolated by panning against recombinant IGF1R extracellular domain (c,f). The top panels display peptide-level results where each data point represents a unique identified peptide sequence. Data points corresponding to proteins of interest are represented in black or yellow. The bottom panels display protein-level results where each data point represents a summed result from all corresponding peptides. Proteins that were found to be significantly enriched in one sample relative to the other are highlighted in red and labelled with their HGNC symbol. Each experiment represents 3 individual biological repetitions.

