
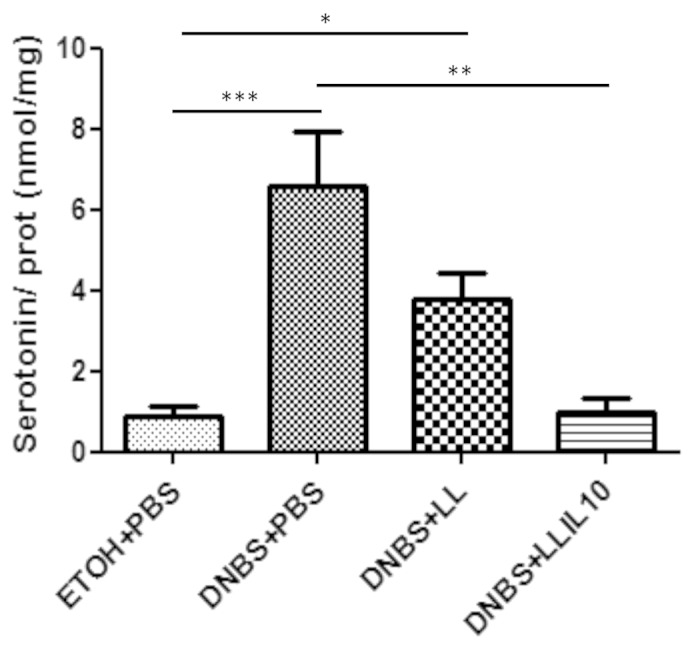
Figure 8. Colon serotonin concentrations in DNBS micro-inflammation model. Control non-inflamed (EtOH+PBS), control inflamed (DNBS+PBS), LL-treated mice (DNBS+LL), and LL-IL10-treated mice (DNBS+LL-IL10) (n = 16). *P < 0.05, **P < 0.001, ***P < 0.0001.