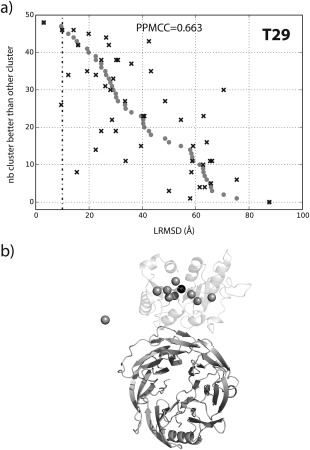
Figure 4.

Predictions for T29 based on the standard ERT classifier. (a) the predicted number of times a cluster is better vs. all other clusters (black cross) compared to the actual values (gray dots). The LRMSD values on the x axis are based on the cluster member with the lowest LRMSD. The bottom panel (b) shows the receptor (dark gray cartoon representation) and a sphere indicating the center of mass of the centroid model for each cluster. The top 10 ranked clusters (black: rank 1, gray: rank 2–10) are shown. The transparent cartoon indicates the observed position of the ligand from the crystal structure (PDB: 2VDU47).
