
Figure 4.
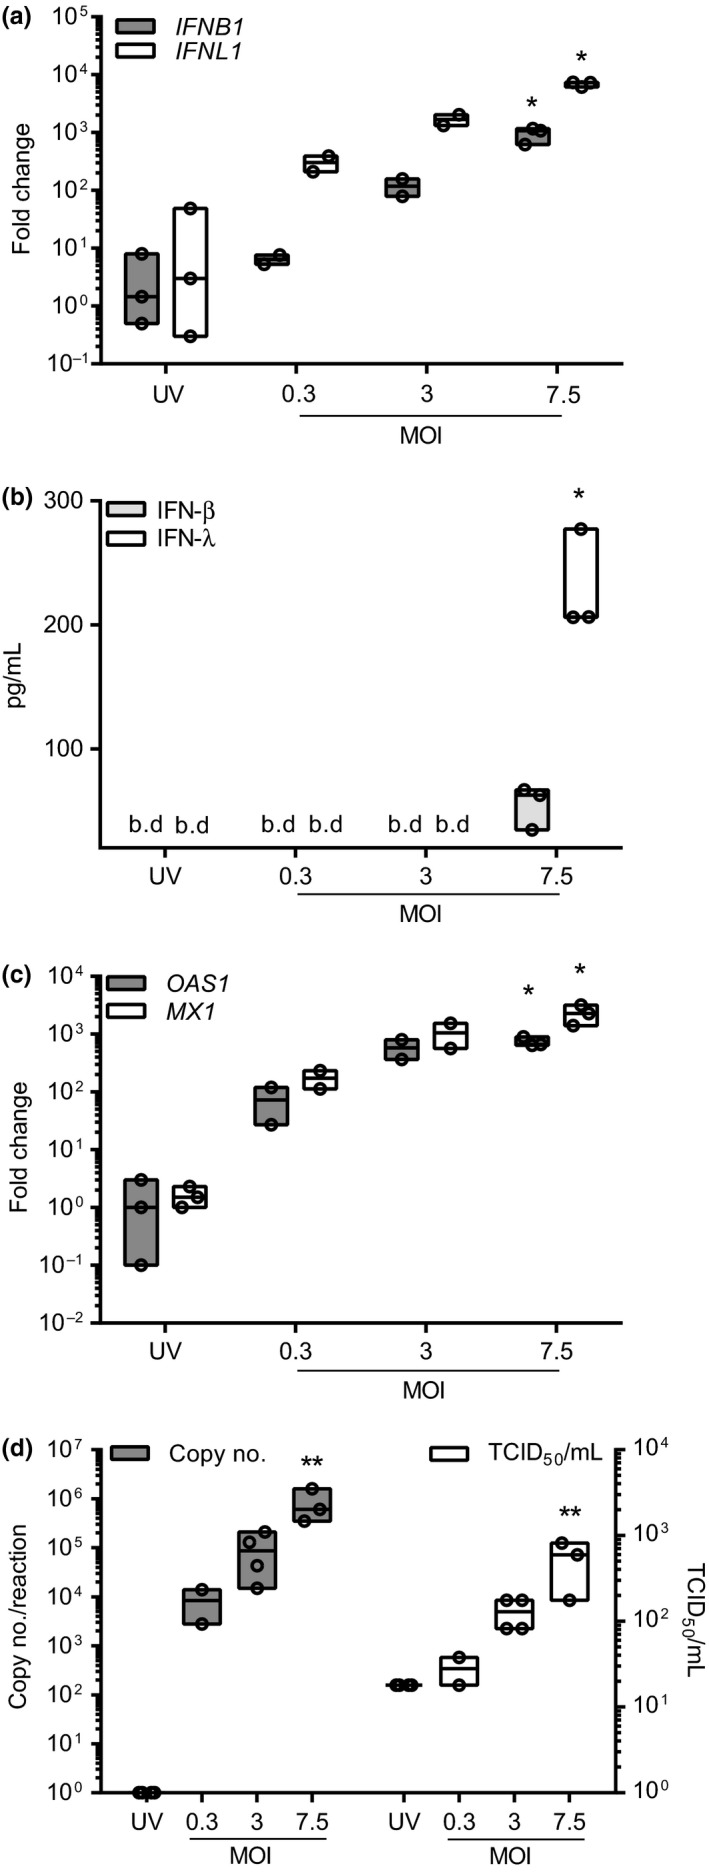
Innate immune responses and release of infectious RV16 from CBMCs. CBMCs were exposed to RV16 at MOI 0.3, 3 or 7.5 or UV‐RV16 MOI 7.5 (control). Twenty‐four h post‐infection cell pellets were harvested for gene expression and viral RNA by RT‐qPCR and cell‐free supernatants for protein expression by ELISA and infectious virus particles by TCID 50 assay. (a) IFNB1 and IFNL1 mRNA expression. (b) IFN‐β and IFN‐λ protein expression. (c) OAS1 and MX1 mRNA expression. (d) RV16 copy number and TCID 50/mL. Results are floating bars representing the median with min and max values, n = 2–4, *P ≤ 0.05, **P ≤ 0.01, vs. UV‐RV16 (n = 3–4). MOI, multiplicity of infection. b.d., below limit of detection.