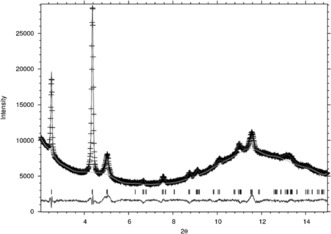
Figure 3.

Final plot showing the observed (experimental) synchrotron X‐ray diffraction data (crosses), and the calculated XRD pattern (solid line) from the final Rietveld refinement, together with the difference between the two. Tick marks indicate the position of Bragg reflections.
