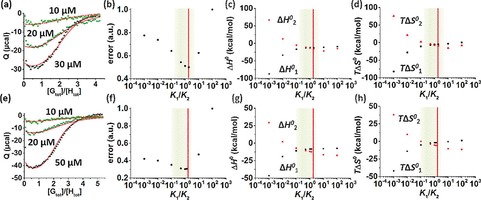
Figure 2.

ITC data (markers) of binding CB[8] (H, three initial concentrations) with PheGly2 (G) (a) and PheGly6 (G) (e) in PBS (10 mm phosphate buffer, 2.7 mm KCl and 137 mm NaCl, pH 7.4). ITC data (see also Figures S1–S6 in the Supporting Information) were simultaneously fitted (solid lines) to a model with K 1, K 2, ΔH 0 1, and ΔH 0 2 as fit parameters. Representative plots of the normalized least‐squares fit error, ΔH 0 and −TΔS 0 calculated at fixed values of the K 1/K 2 ratio for PheGly2 (b–d) and PheGly6 (f–h). Red vertical lines indicate the non‐cooperative case (K 1/K 2=2), green areas represent the acceptable ranges of K 1/K 2 within 20 % of the minimum fit error and of enthalpy–entropy compensation.
