
. 2016 Oct 3;14(2):135–145. doi: 10.1111/jjns.12147
© 2016 The Authors Japan Journal of Nursing Science published by John Wiley & Sons Australia, Ltd on behalf of Japan Academy of Nursing Science
This is an open access article under the terms of the Creative Commons Attribution‐NonCommercial‐NoDerivs License, which permits use and distribution in any medium, provided the original work is properly cited, the use is non‐commercial and no modifications or adaptations are made.
Figure 1.
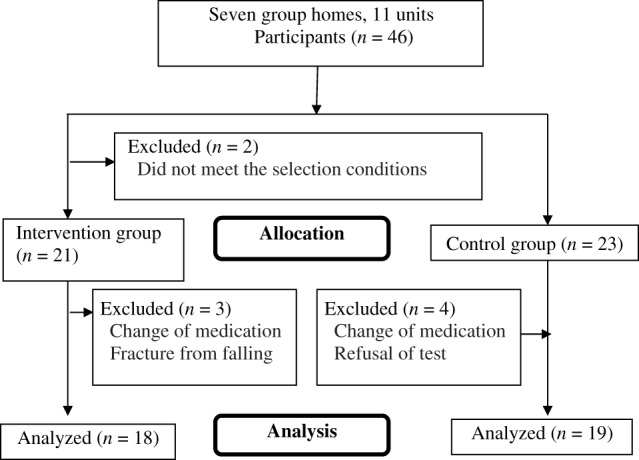
Flow chart showing the participants, group allocation, and analysis.