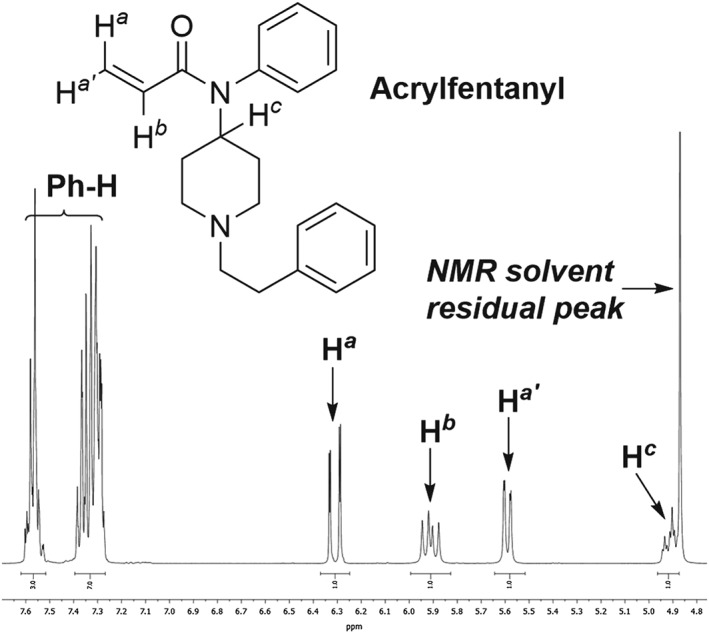
Figure 5.

1H‐NMR spectrum of acrylfentanyl (CD3OD, 400 MHz). Enlargement of the region where signals arising from the terminal alkene are observed. See supporting information for the complete 1H‐ and 13C‐NMR spectra for acrylfentanyl and 1H‐NMR data for fentanyl.
