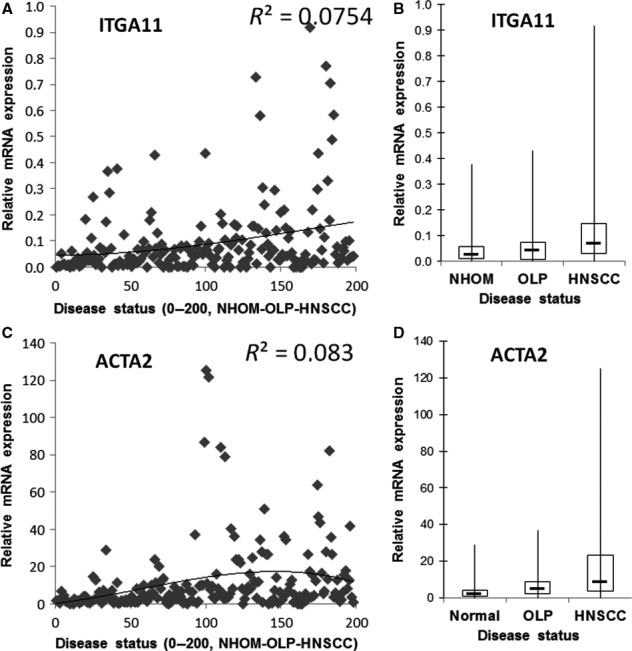
Figure 1.

Expression of integrin α11 (A and B) and α‐SMA (ACTA2) (C and D) is upregulated in HNSCC at mRNA level when compared to normal human oral mucosa (NHOM) and oral lichen planus (OLP). The relative mRNA expression (y‐axis) is plotted as individual data points in A and C and the correlation curve between the level of expression and disease status (x‐axis) is shown. The same data (relative mRNA expression on y‐axis) is summarized for each disease status (NHOM, OLP or HNSCC) and shown as box plots in B and D.
