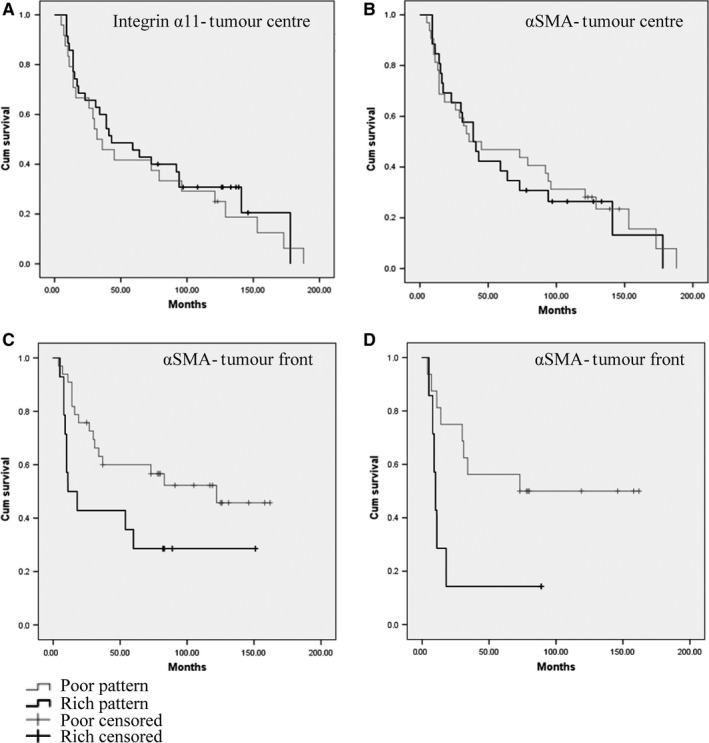
Figure 3.

Survival analysis (Kaplan–Meier curves) showing no correlation between the expression of integrin α11 (A) or α‐SMA (B) and overall survival when quantified at tumour centre (FF samples). Correlation between the ‘rich’ expression pattern of α‐SMA at ITF (FFPE samples) and overall survival was found for both: all sites including tongue (C) and other sites than tongue (D).
