
Figure 2.
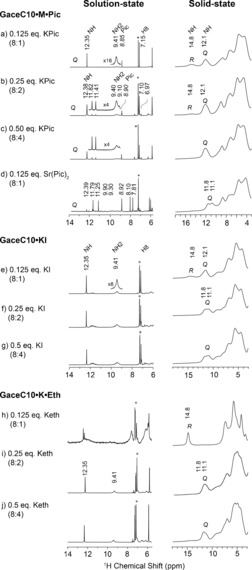
One‐pulse 1H solution‐state (left, 400 MHz, 8 mm in CDCl3) and solid‐state (right, 850 MHz, 75 kHz MAS) NMR spectra of GaceC10⋅K⋅Pic a) 8:1, b) 8:2 and c) 8:4 complexes, d) a GaceC10⋅Sr⋅(Pic)2 8:1 complex; GaceC10⋅KI, e) 8:1, f) 8:2, g) 8:4 complexes; and GaceC10⋅K⋅Eth h) 8:1, i) 8:2, and j) 8:4 complexes. Chemical shifts corresponding to NH, NH2 and H8 (the aromatic CH) protons in GaceC10 and to picrate are noted, while the asterisk indicates the residual chloroform peak–note that the 1H solution‐state chemical shifts for c) GaceC10⋅K⋅Pic 8:4 are the same as for b) GaceC10⋅K⋅Pic 8:2. Q and R denote quartet and ribbon‐like assembly, respectively, with a Q/R ratio wt/wt (±5), 65:35 in (a), 84:16 in (b) and 64:36 in (e) as measured by a line shape fitting analysis of the NH peaks (Supporting Information, Figure S5).