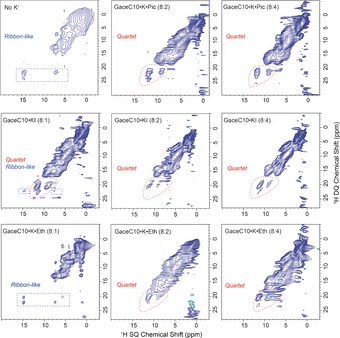
Figure 5.

Two‐dimensional 1H (850 MHz, 75 kHz MAS) DQ‐SQ correlation solid‐state MAS NMR spectra of GaceC10 alone (top left) and GaceC10 complexes with K+ ions, recorded using 1 τ r of BABA recoupling.19 Top: GaceC10, GaceC10⋅K⋅Pic 8:2 and 8:4 complexes; middle: GaceC10⋅KI 8:1, 8:2 and 8:4 complexes, and bottom: GaceC10⋅K⋅Eth 8:1, 8:2 and 8:4 complexes.
