
Figure 6.
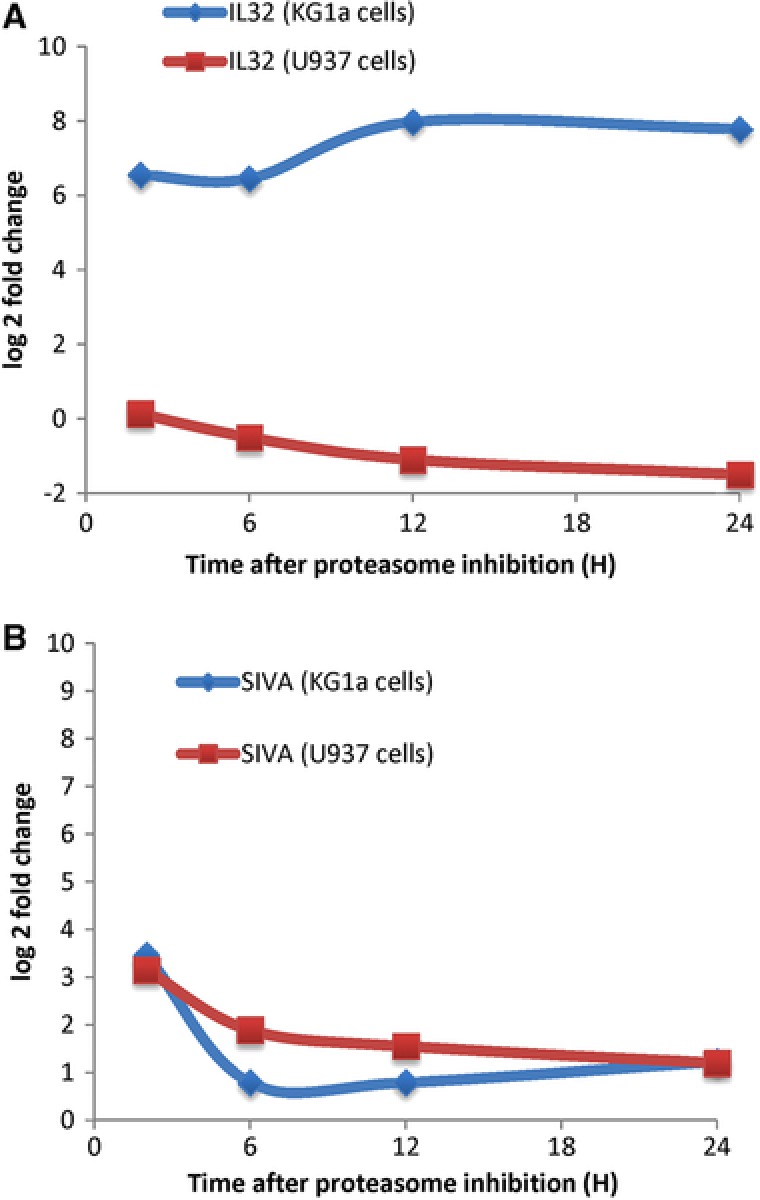
Differential regulation of IL32 and SIVA upon the proteasome inhibition measured by SRM. Cells were treated with 10 nM bortezomib and total protein were extracted and digested with trypsin and measured by SRM (see Materials and Methods). Graph reported the protein abundances (log 2 Fold change) over time (0 to 24 h) of IL32 (A) and SIVA (B) proteins after proteasome inhibition with bortezomib of both KG1a (blue) and U937 (red) cells. Results correspond to the mean ± SD of at least three independent experiments.