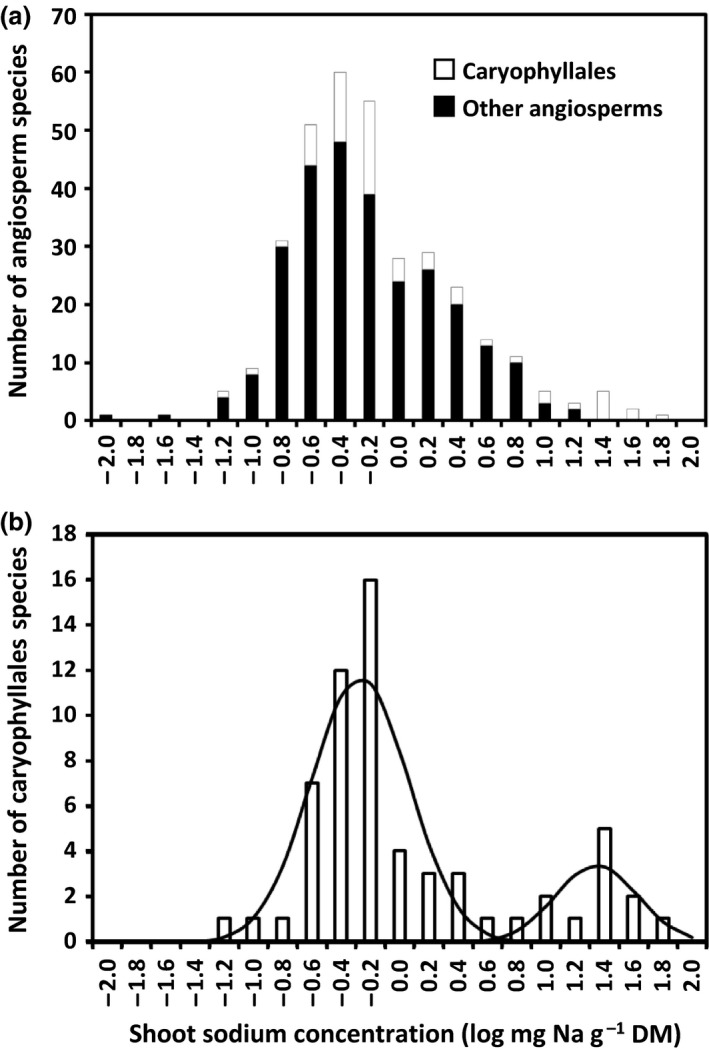
Figure 2.

Frequency distributions of log‐normal mean shoot sodium (Na) concentrations in (a) 334 species from 35 angiosperm orders and (b) 61 species from 10 Caryophyllales families, grown hydroponically in a nonsaline solution. The solid line indicates two log‐normal distributions (first: mean = −0.3717, SD = 0.3299, n = 49 species; second: mean = 1.246, SD = 0.2756, n = 12 species) fitted to the data from the 49 Caryophyllales species with the smallest leaf Na concentrations and the 12 Caryophyllales species with the largest leaf Na concentrations, respectively.
