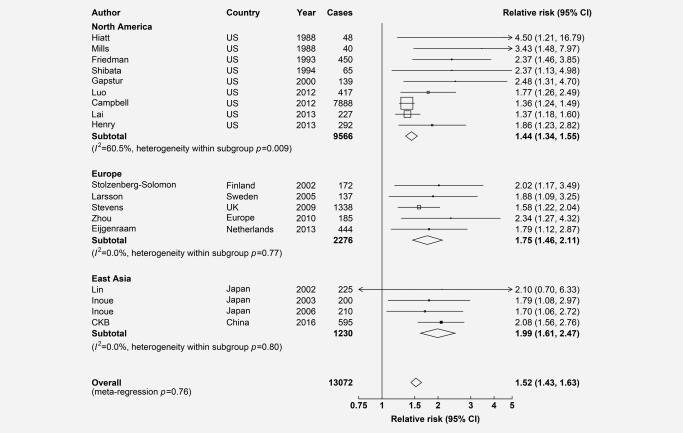
Figure 2.

Adjusted RRs for PC associated with previously diagnosed diabetes in meta‐analysis of CKB and 17 published studies, by regions. Boxes represent the relative risks (RRs) associated with previously diagnosed diabetes for individual studies, with the size of the box inversely proportional to the variance of the logRR. Open boxes represent previously published studies and the black box represents CKB. Diamonds represent summary RRs for overall and each region. Within categories RRs are ordered according to their year of publication. Estimates and 95% CI of the summary RRs are in bold.
