
Figure 3.
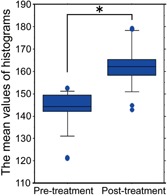
The improvement measured by the values of the gray level histograms at the first pre‐treatment visit and the last post‐treatment visit. A statistically significant difference was observed (P = 0.0001). Data represent the means ± SD. Significant difference is indicated by (*).