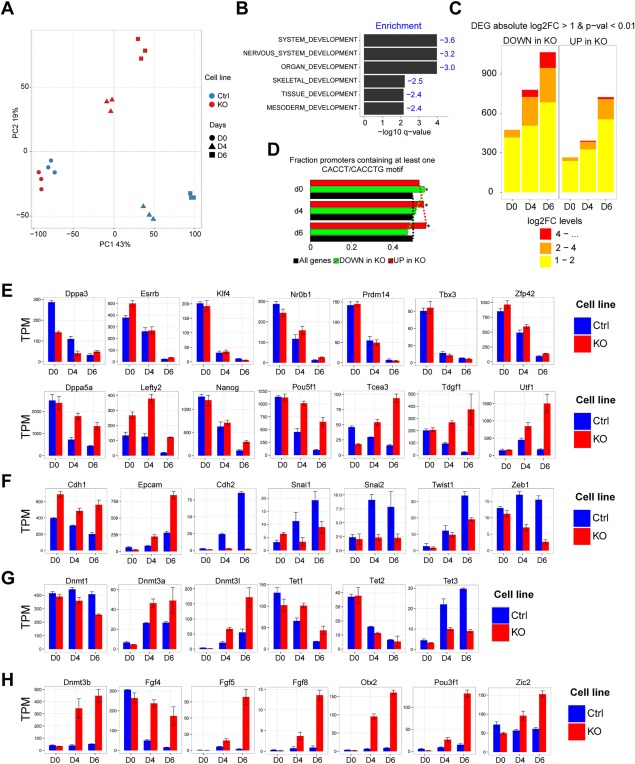
Figure 2.

Analysis of temporal RNA‐seq. (A): Principal component analysis based on transcripts per million (TPM). (B): GSEA‐P for differentially expressed genes (DEG) in time‐series analysis. The height of the bar plot represents significance and the corresponding negative enrichment score is indicated (blue). (C): Bar plot displays numbers of DEGs using pairwise DESeq2 test (|log 2FC| > 1 and p < 0.01). Colors represent binned absolute log2FC levels. (D): Promoter analysis for putative bipartite Zeb2‐binding motifs (CACCT/CACCTG sequences with maximum gap of 45 bp; see main text) of DEGs between Zeb2 KO versus Ctrl. Red bar = selective analysis for upregulated DEG, demonstrates statistical overrepresentation (Fisher's exact test p value = 1.044e‐08). Green bar = selective analysis for downregulated DEG points to underrepresentation. (E‐H): TPM bar plots at the indicated time points for pluripotency‐related genes (E), selected epithelial‐to‐mesenchymal transition genes (F) and selected methylation‐related genes (G) and epiblast (H). Abbreviations: DEG, differentially expressed genes; TPM, transcripts per million.
