Figure 5.

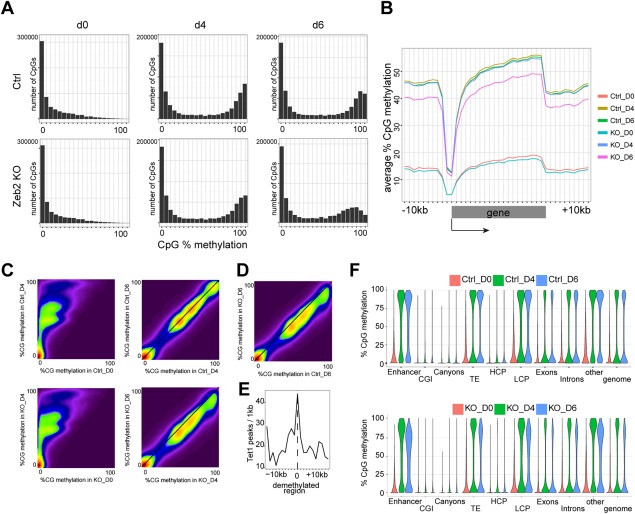
Analysis of temporal RRBS during neural differentiation. (A): Distribution histogram for individual meCpGs on d0, d4, and d6 in Ctrl and Zeb2 KO populations. (B): meCpG distribution at gene bodies and 10kb‐flanking regions of protein‐coding genes. (C): Density plots for pairwise comparisons of meCpG (in 400bp‐tiles) between d0 and d4 in Ctrl (top) and d4 and d6 in KO (bottom) cells. (D): Density plot for pairwise comparison of meCpG (in 400bp‐tiles) on d6 between Ctrl and KO. In C, D the density points increase from purple to dark red. (E): Enrichment plot of Tet1‐binding peaks centered around demethylated regions on d6 in a pairwise comparison between Zeb2 KO versus Ctrl. (F): Violin plots showing gain and loss‐of‐methylation over time in identified genomic regions, that is, enhancers, CpG islands, canyons, transposable elements, high‐CpG content promoters (HCP), low‐CpG content promoter, exons, introns, other nondefined genomic regions, and globally at the whole‐genome (genome) in Ctrl and Zeb2 KO cells. Abbreviations: CGI, CpG islands; TE, transposable elements; HCP, high‐CpG content promoters; LCP, low‐CpG content promoter.
