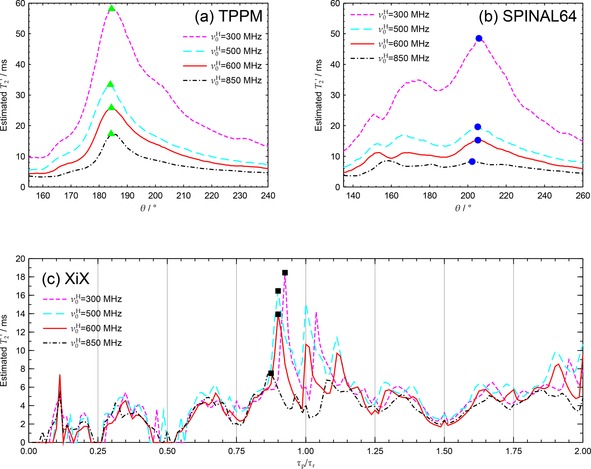
Figure 3.

Experimental across a) TPPM, , b) SPINAL‐64, and c) XiX parameter map cross‐sections at (magenta), 500 MHz (cyan), 600 MHz (red) and 850 MHz (black). Datasets acquired using and (XiX used to ensure synchronisation of pulse width increments with the MAS period). The region of the XiX parameter maps was relatively featureless and is omitted for clarity. Hardware configurations 1–4 were used, with CP contact times of 2.7, 1.2, 2.7 and 1.8 ms respectively (see Table 1). Small mis‐calibrations of the by 1 and 4 kHz for the 600 and 850 MHz datasets respectively have been taken into account in (a) and (b) by adjusting the calculated tip‐angle, . Peak decoupling points marked by triangles, circles and squares are shown as a function of 1/ in Figure 4.
