Figure 6.

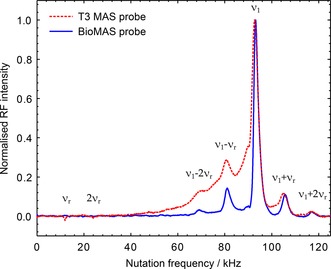
1H nutation spectra measured through 13C using T3 MAS and BioMAS probes, hardware configurations 6 and 7 respectively (see Table 1). Peak nutation frequencies are at . Spectra acquired at and using CP conditions with 1.2 ms contact time.

1H nutation spectra measured through 13C using T3 MAS and BioMAS probes, hardware configurations 6 and 7 respectively (see Table 1). Peak nutation frequencies are at . Spectra acquired at and using CP conditions with 1.2 ms contact time.