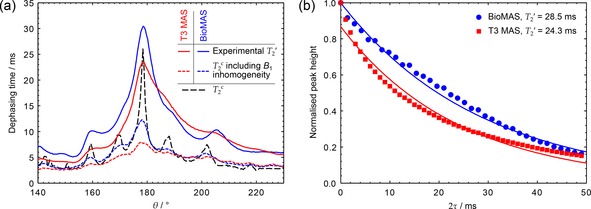
Figure 7.

a) Experimental and simulated across TPPM parameter map cross‐sections at , using T3 MAS (red) and BioMAS probes (blue), hardware configurations 6 and 7 respectively (see Table 1). Datasets were acquired using , and , with a CP contact time of 2 ms. A small mis‐calibration of the by 2 kHz for the T3 probe dataset has been taken into account when calculating the tip‐angle, . b) Experimental decay curves under optimal TPPM decoupling, corresponding to the peaks in (a). Solid lines represent fits to a mono‐exponential decay, with the decay constant shown in the legend.
