
Figure 9.
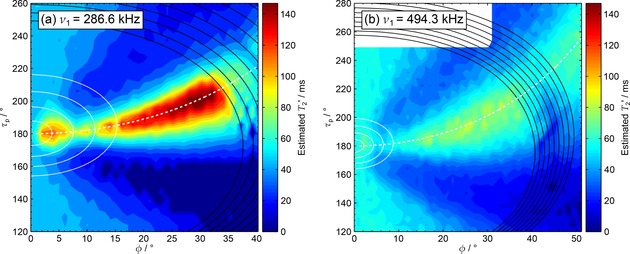
Experimental under TPPM decoupling at , and a) , b) . The solid lines represent recoupling resonance conditions for heteronuclear interactions (black) and purely homonuclear interactions (white) as described in Ref. 59. Decoupling optima lie along the dashed white line, . Hardware configuration 8 was used with a CP contact time of 2 ms (see Table 1). Note that data was not acquired in the white region of (b).